Site Visit
|
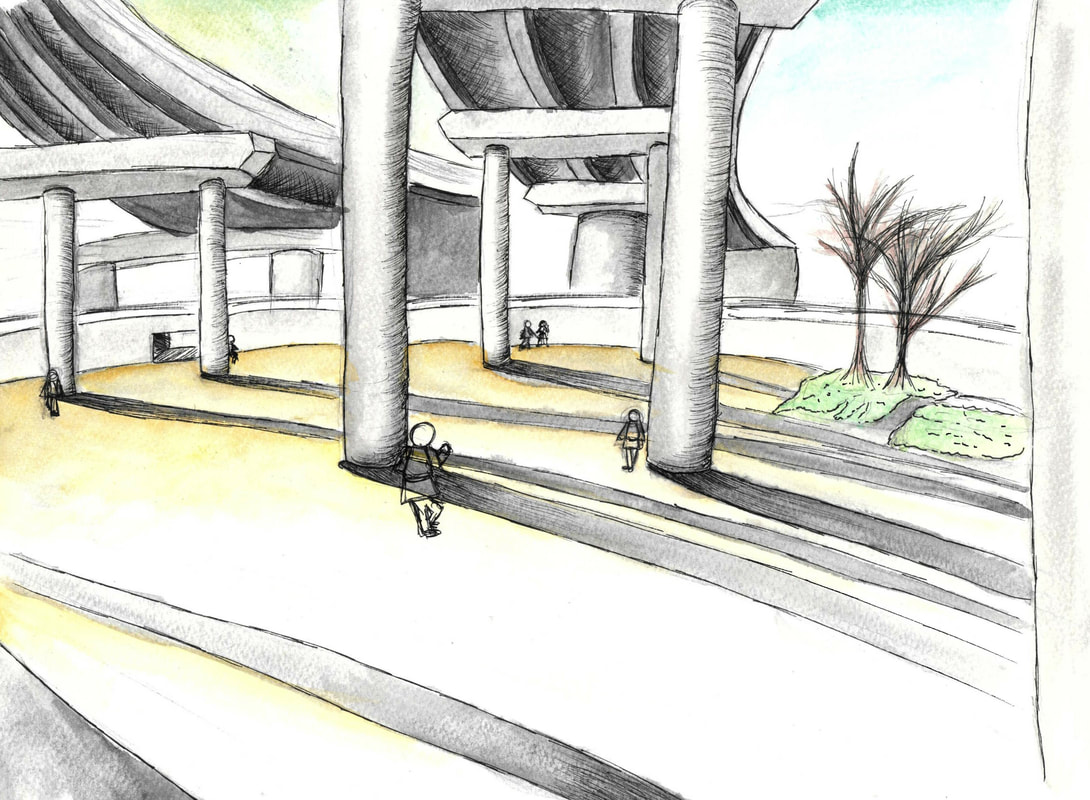
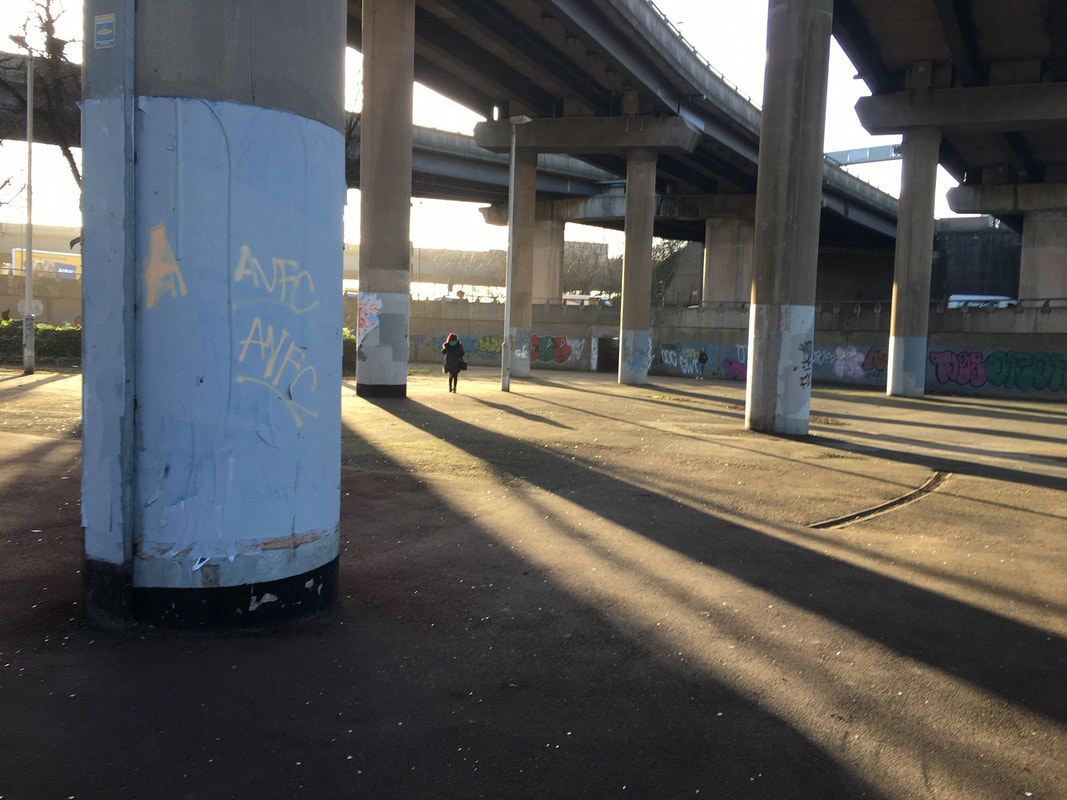
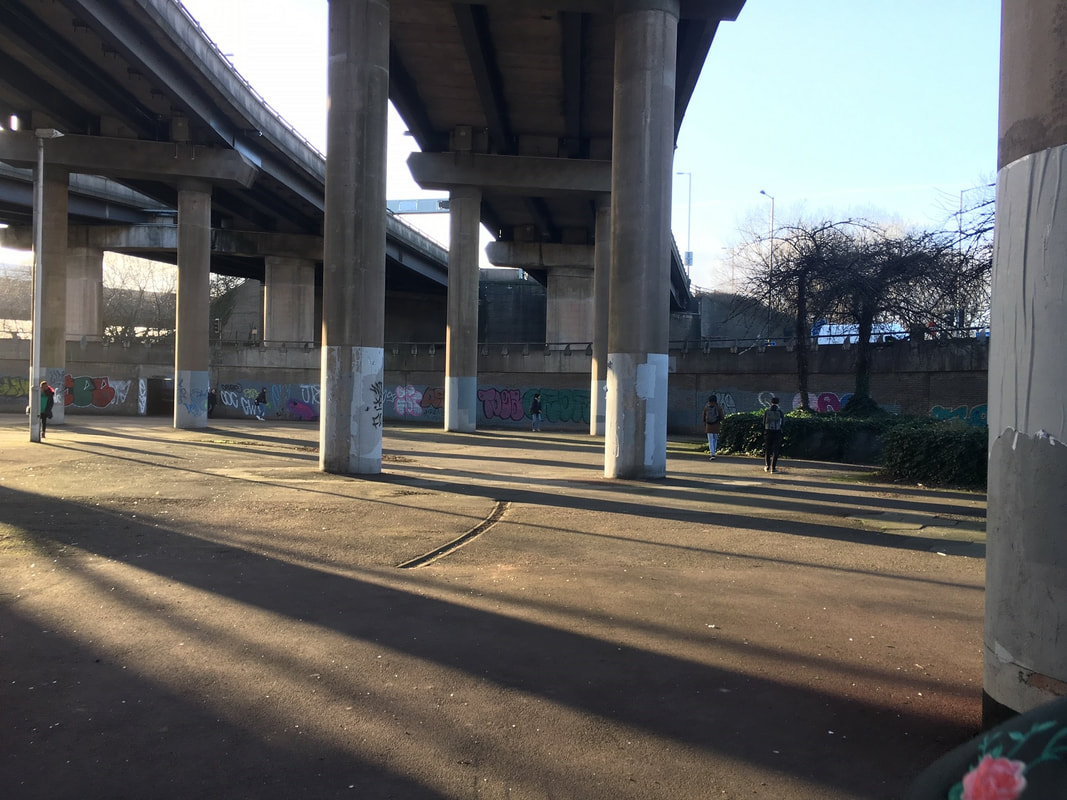
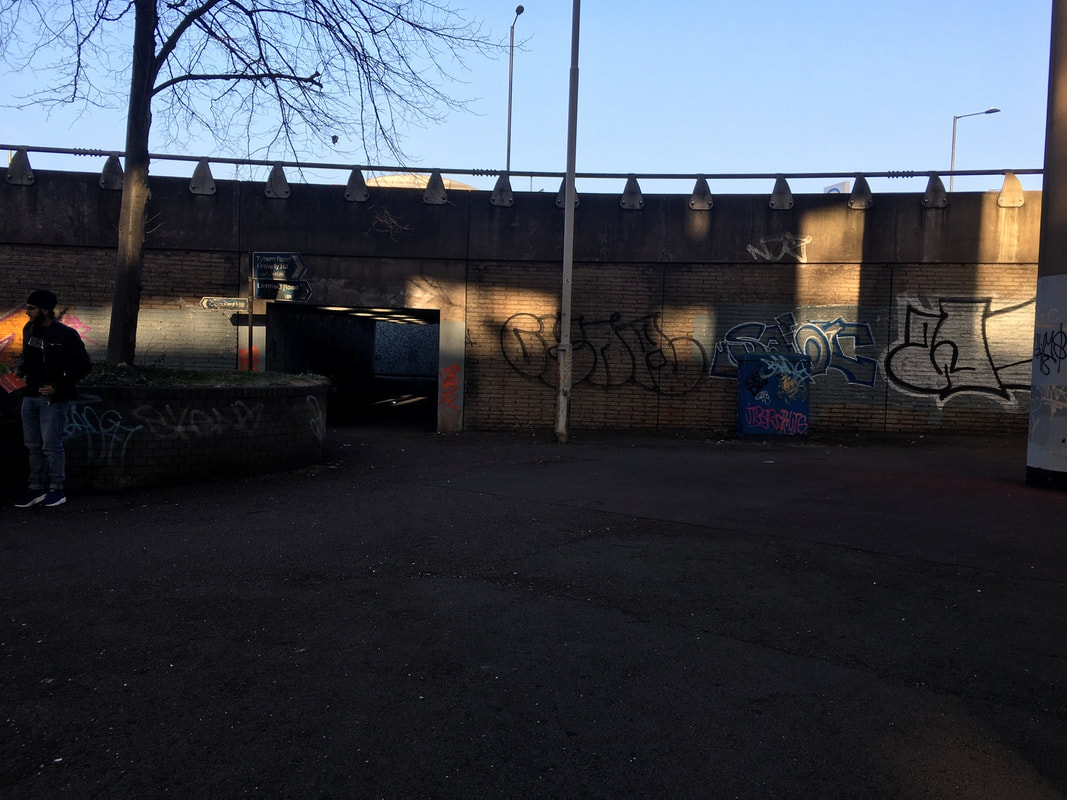
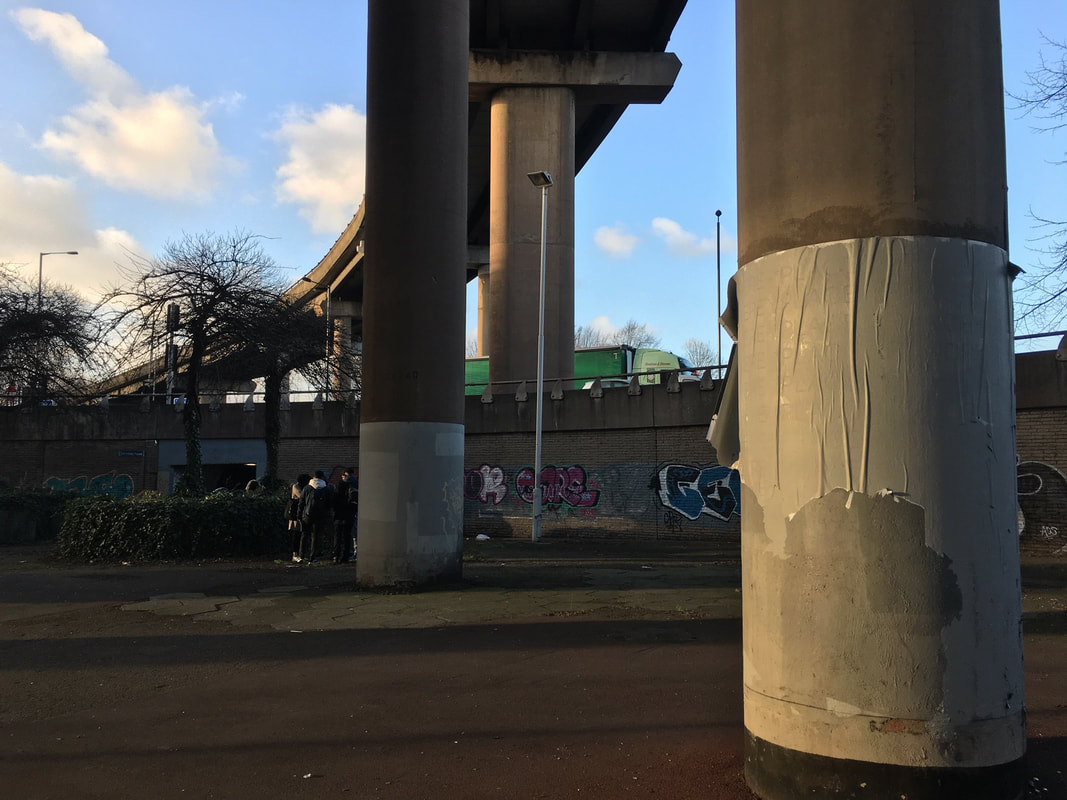
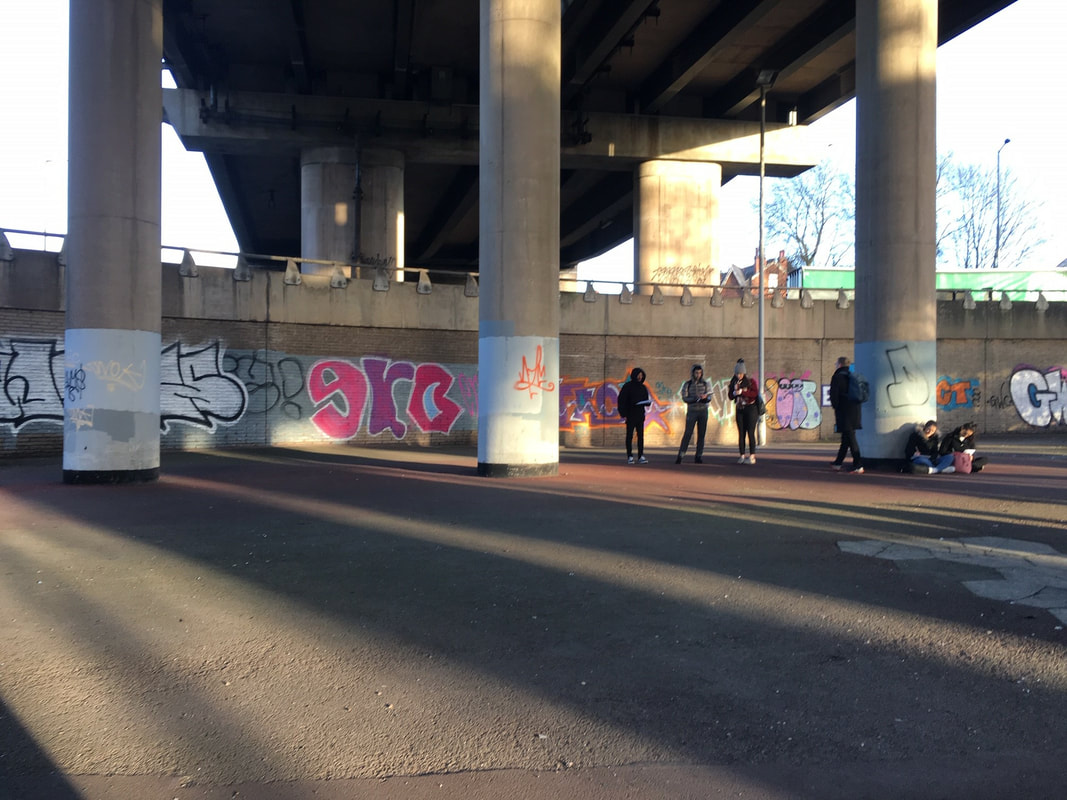
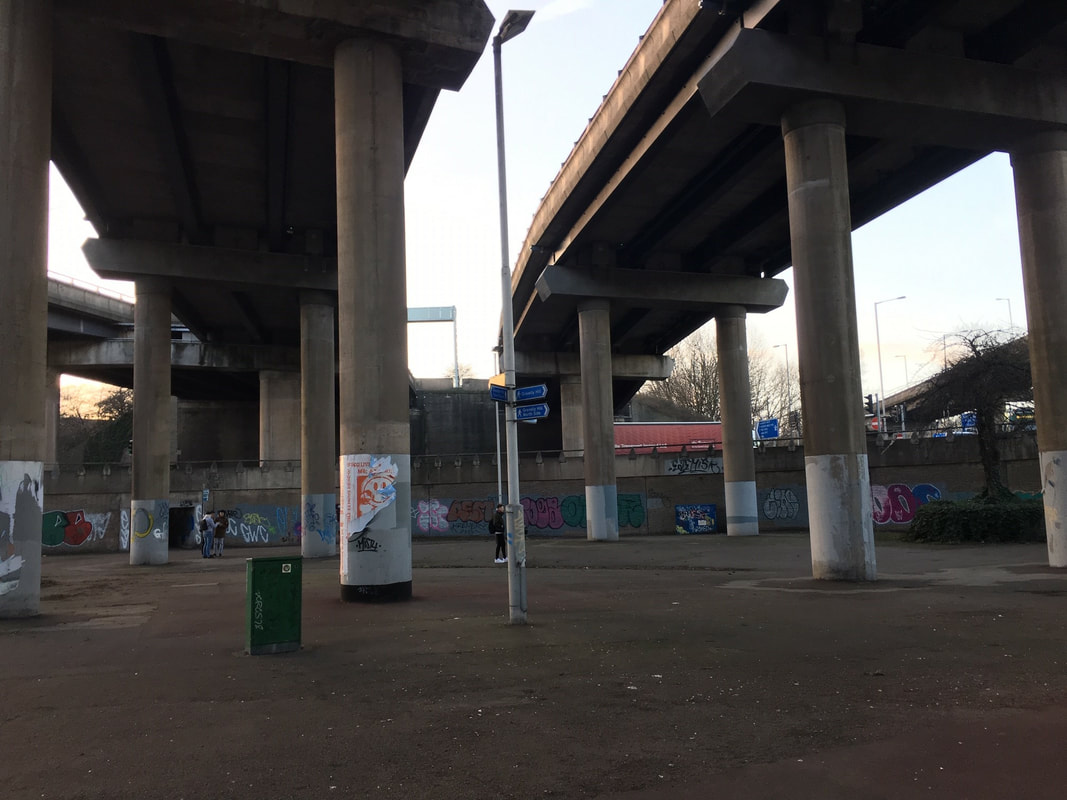
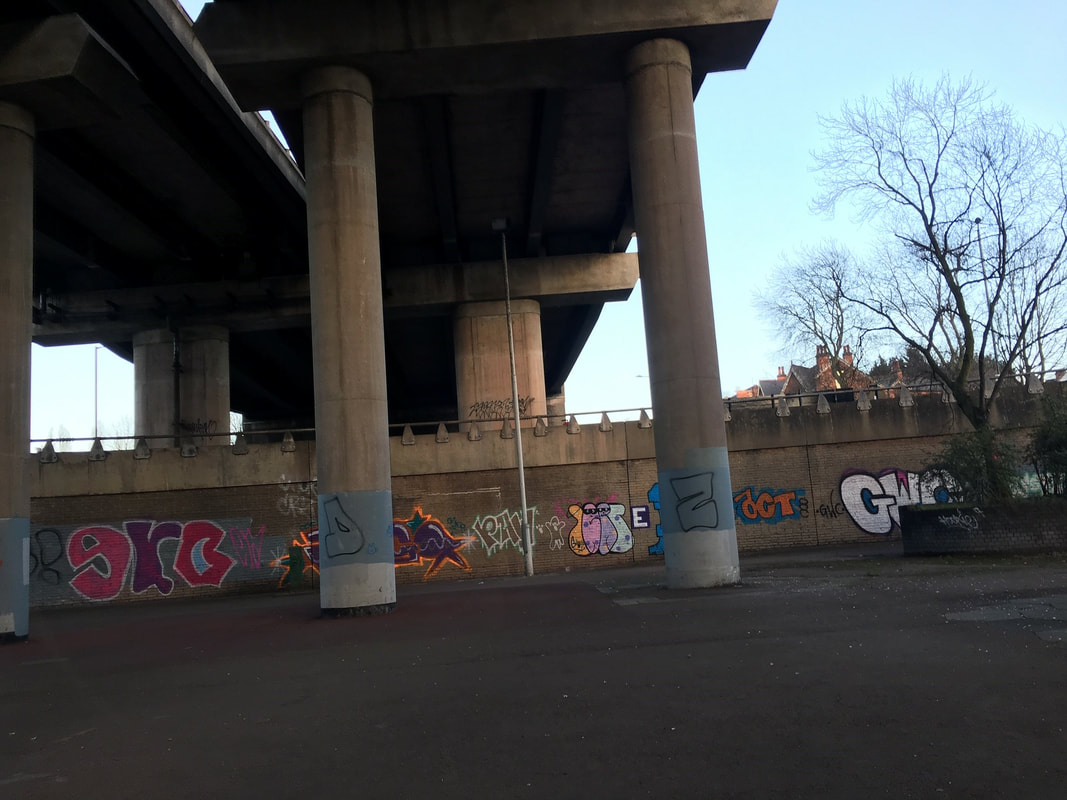
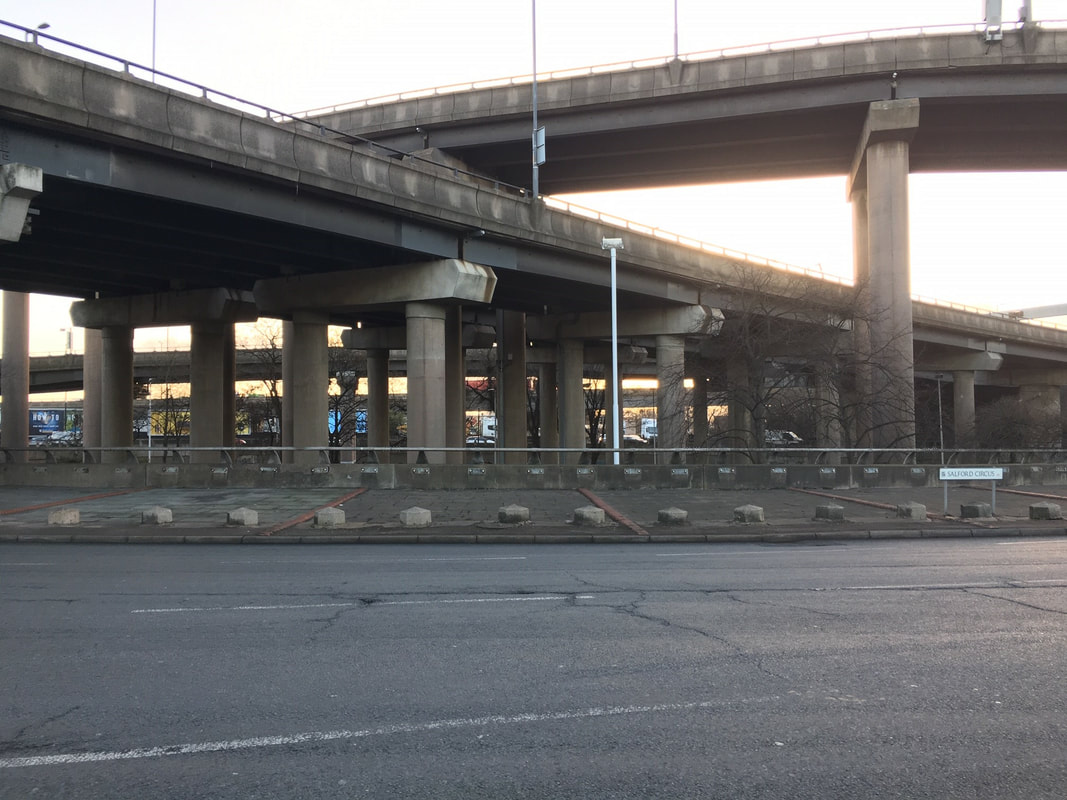
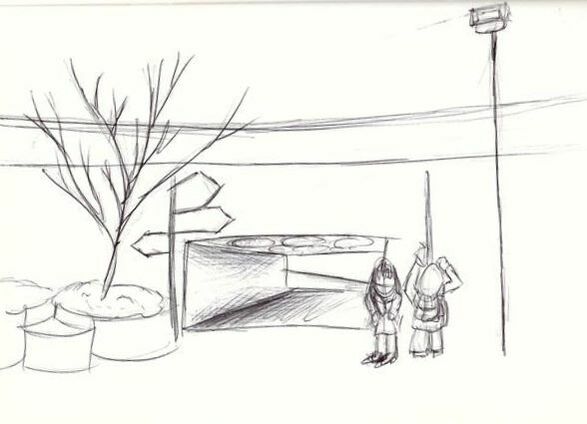
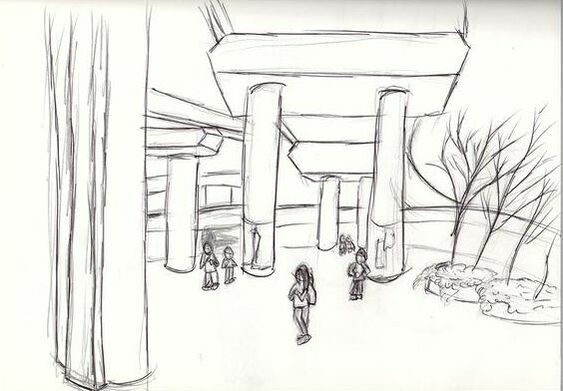
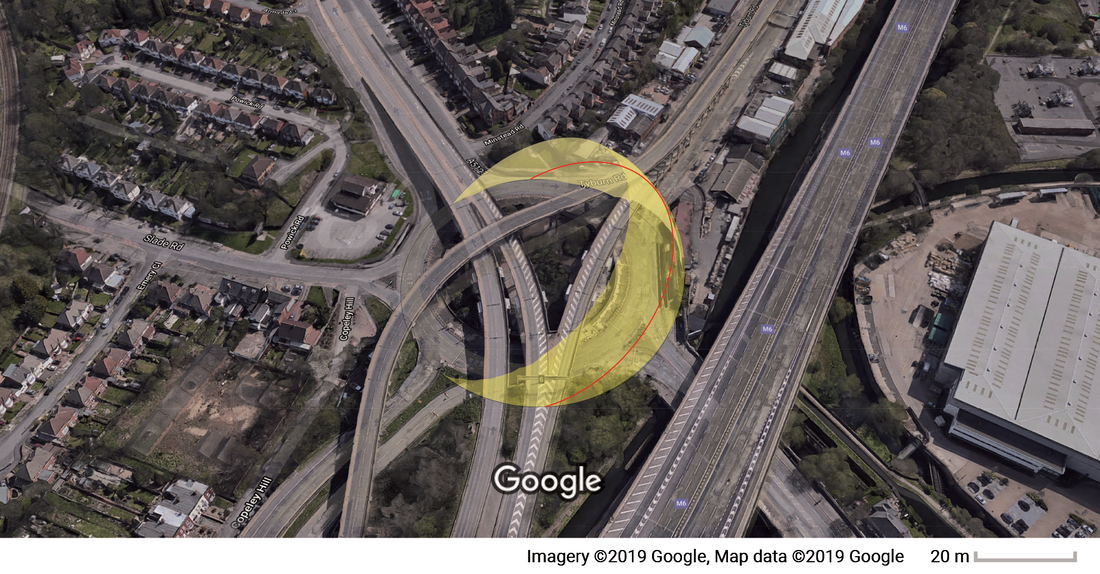
On the 8th January 2019, we visited the Site of our project, under Spaghetti Junction. We were able to get a feel for the urban space and produce sketches of our initial responses to the site. I also noted that the structural support columns varied of diameters 1.5m and 1.2m depending on load they were bearing. To further this finding, the noise level was recorded as being 84.9 dB.

|
|

|

|
|
Solar Path
|
Solar Diagrams, http://andrewmarsh.com/apps/staging/sunpath3d.html, https://www.sunearthtools.com/dp/tools/pos_sun.php#top, Google maps, [accessed 10/01/2019]
Click to Enlarge Image |
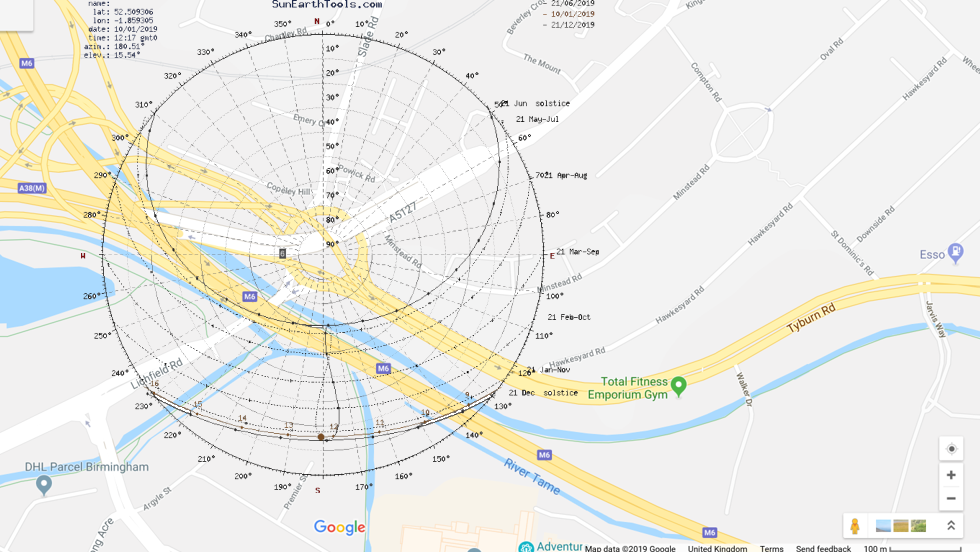
In order to understand how the sun and its solar path interacts with the given site, I researched into solar diagrams. A stereographic solar diagram overlaid onto a Google Map depicts where direct sunlight will be as a result of the path of the sun, which is dependent on the time of year and time of day. From the stereographic diagram, I was able to interpret the depicted data to determine where the sun would be at specific times of the year. During the Summer Solstice at midday (21st June 2019) the sun will be at its highest point in the sky with an altitude of 170° and an azimuth of 56°. During the Winter Solstice (21st December 2019), time of year whereby the sun will be at its lowest, at midday the sun will have an altitude of 13° and an azimuth of 176°.[1]
[1] Solar Path Diagram, Sunearthtools.com, [accessed 10/01/2019] |
Climate
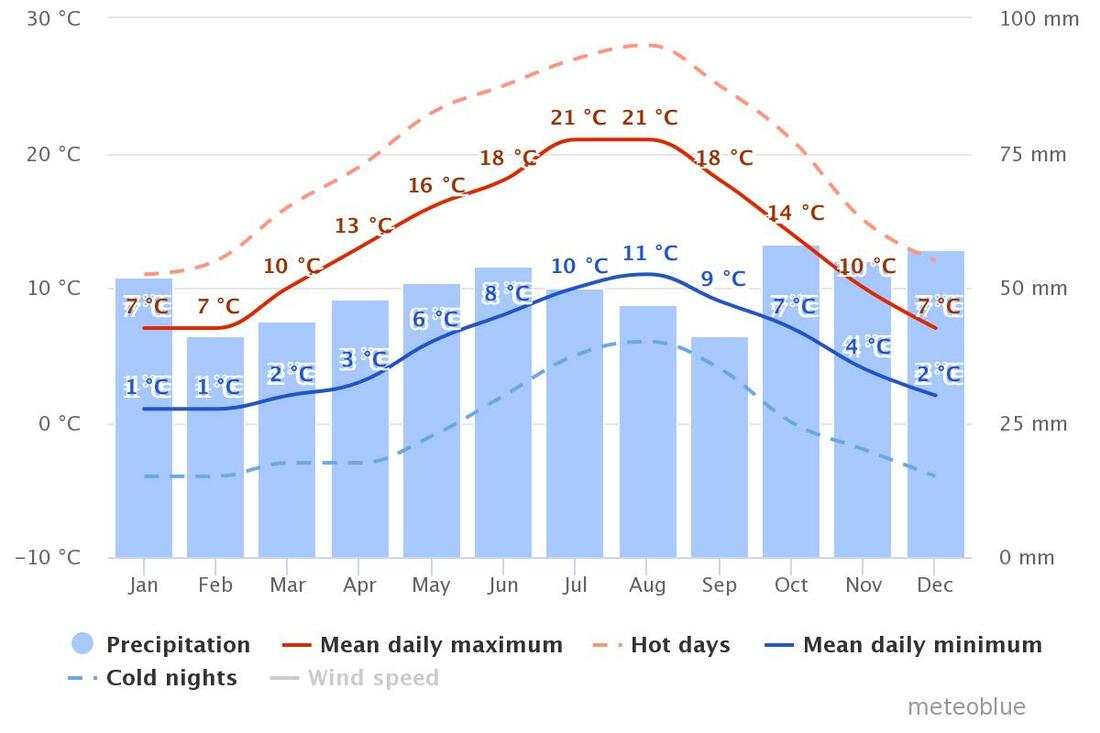
https://www.meteoblue.com/en/weather/forecast/modelclimate/birmingham_united-kingdom_2655603, [accessed 14/01/2018]
|
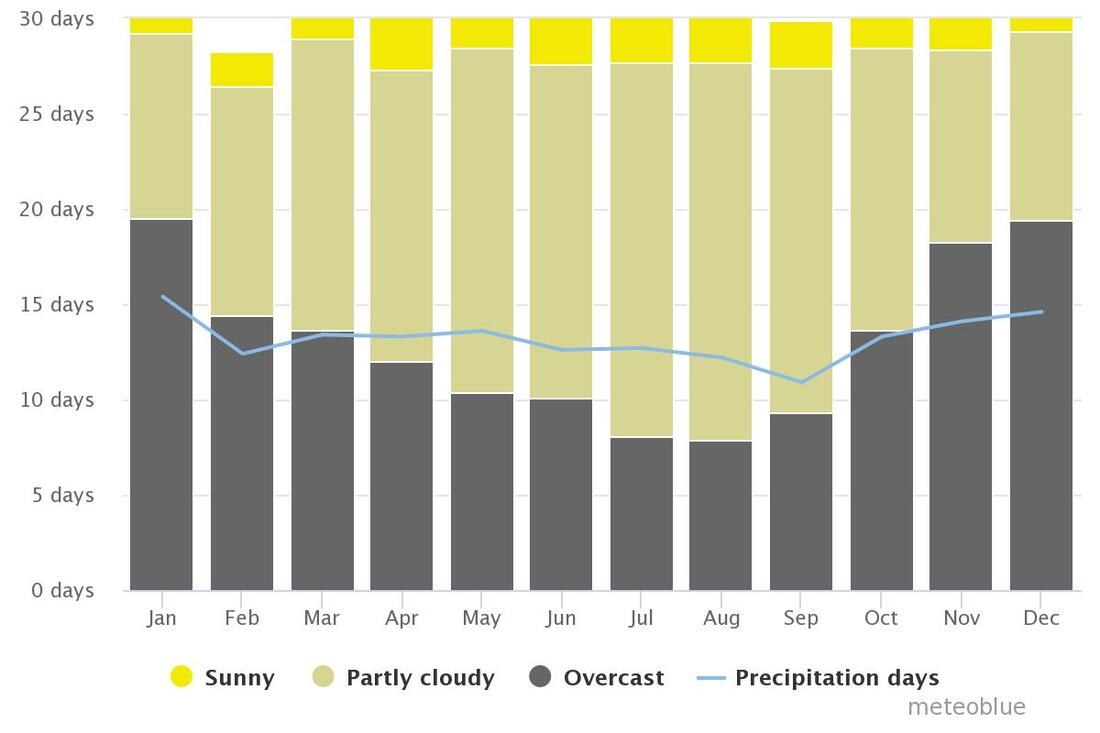
This chart shows how the temperature increases throughout the summer months and how the amount of precipitation slightly increases during the cooler, winter months.
|
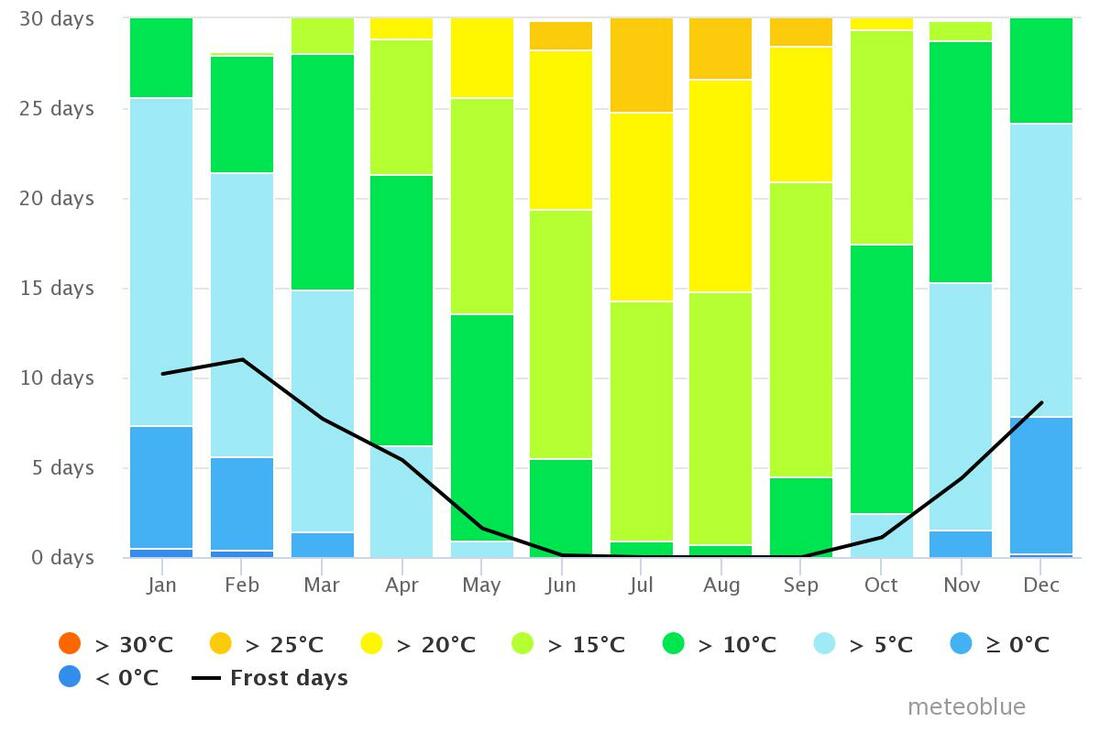
This chart expresses the maximum temperatures throughout the year. During the summer months, the temperature is greater on average than that of the winter months. Also the number of frost days are negligible during the summer months as a result of the raise in temperature.
|
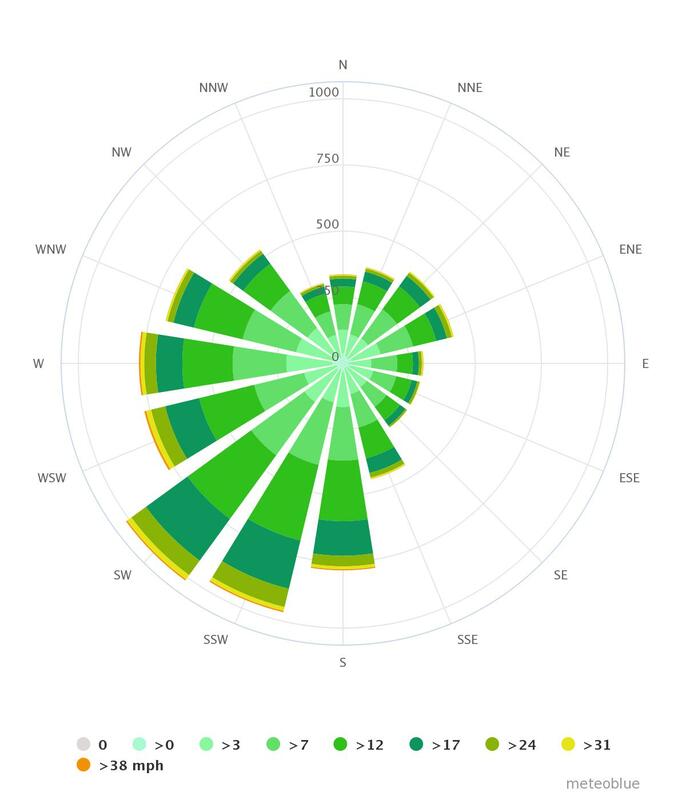
The Wind Chart expresses that the prevailing wind comes from the South Westerly direction onto the site.
|
Social Demographic
|
Mapping of Poverty and Race in Birmingham 2001 census, Cangiano, A., (COMPAS, University of Oxford), http://www.google.co.uk/url?sa=t&rct=j&q=&esrc=s&source=web&cd=1&ved=2ahUKEwi3v4LtyujfAhWO
QxUIHYRiDPkQFjAAegQICBAC&url=http%3A%2F%2Fwww.bhamcommunity.nhs.uk%2FEasySiteWeb%2FGatewayLink.aspx%3FalId%3D13245&usg=AOvVaw1Qp1S5k-8cCjkQfGvLhkS3, [accessed 12/01/2019] |
White
African
|
Chinese
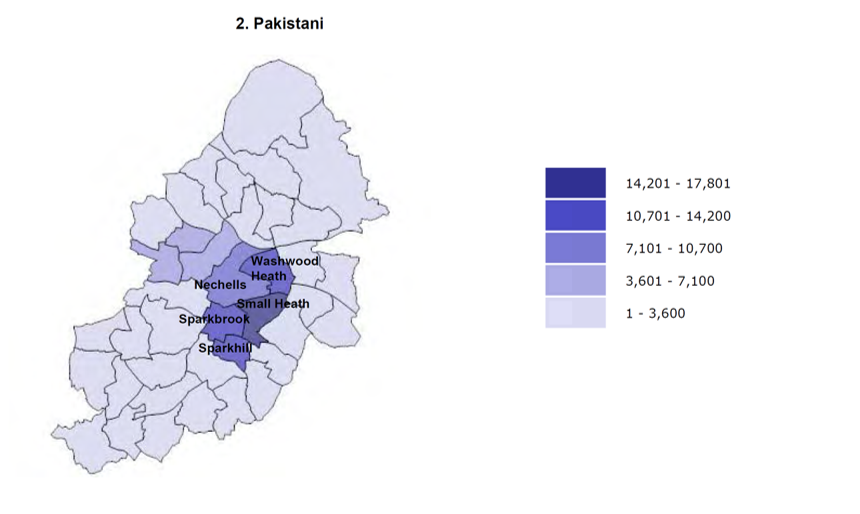
Pakistani
|
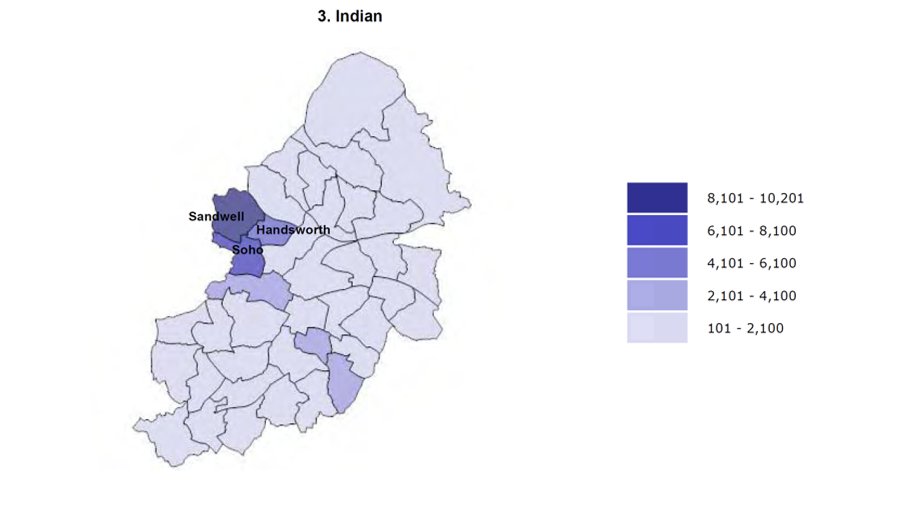
Indian
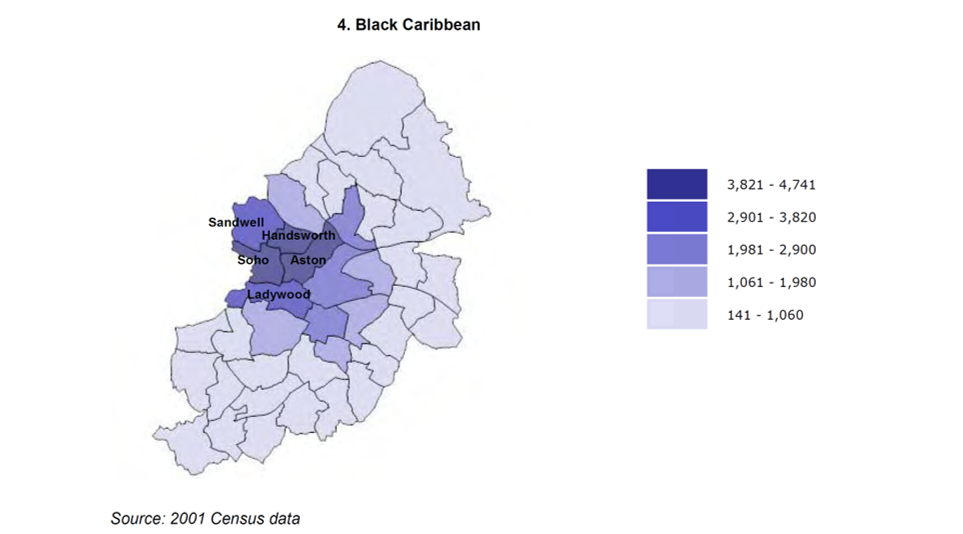
Caribbean
|
|
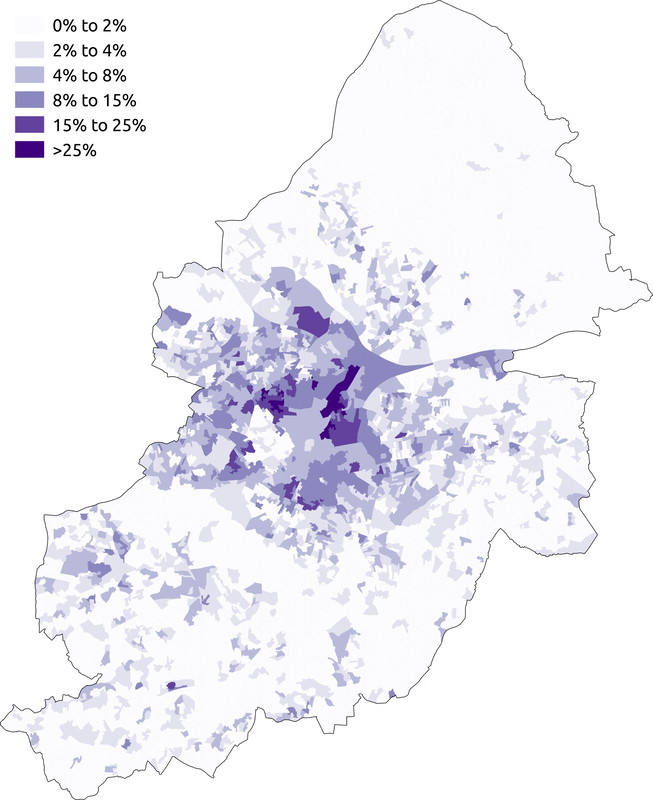
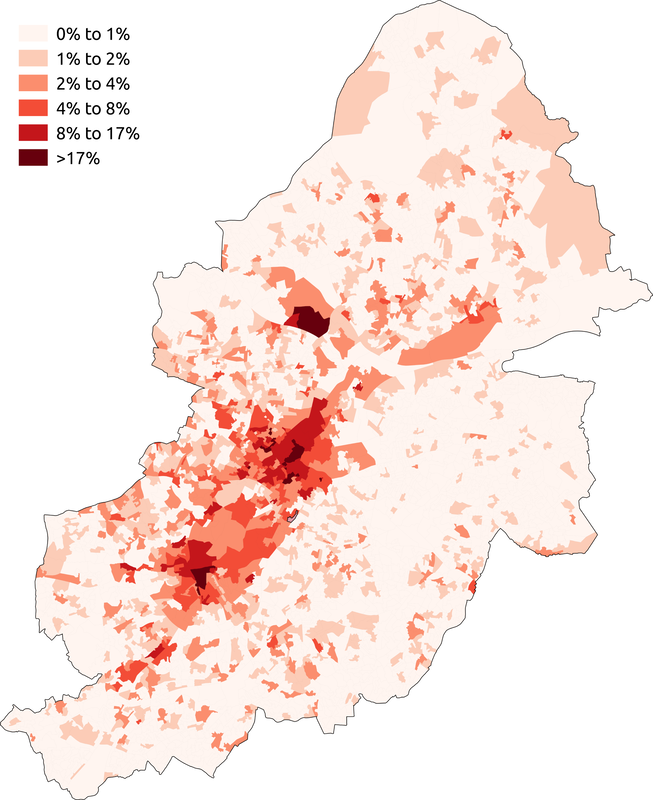
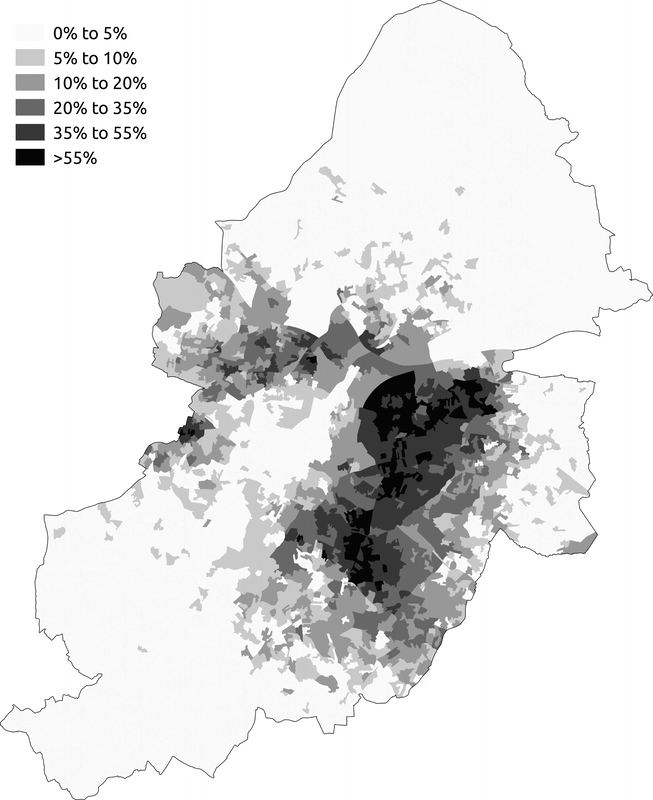
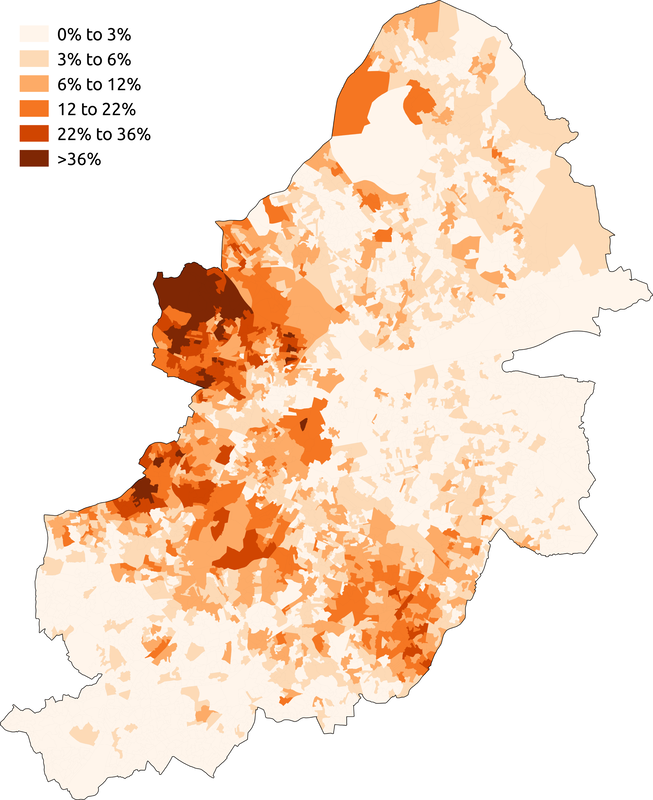
Ethnic Distribution from the 2011 Census, https://en.wikipedia.org/wiki/Demography_of_Birmingham, [accessed 14/01/2019]
|
I
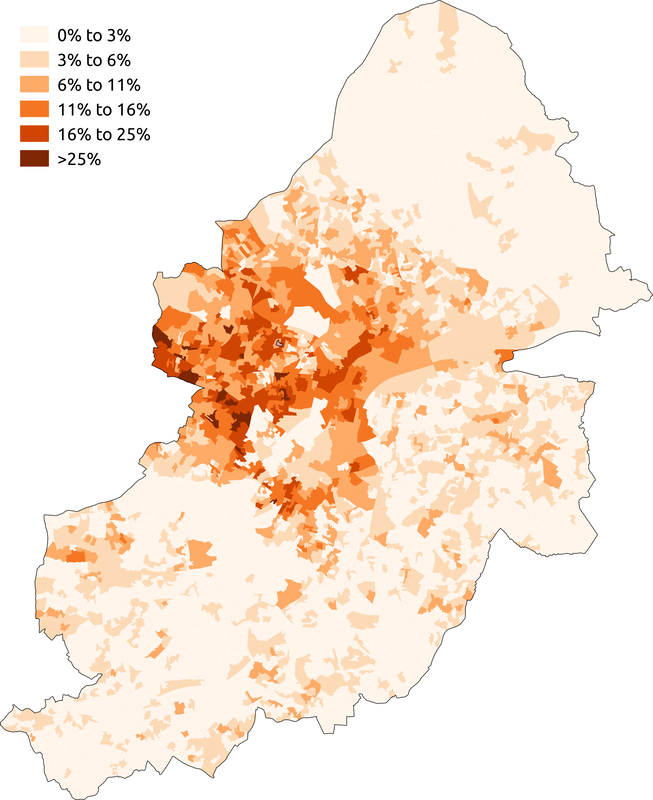
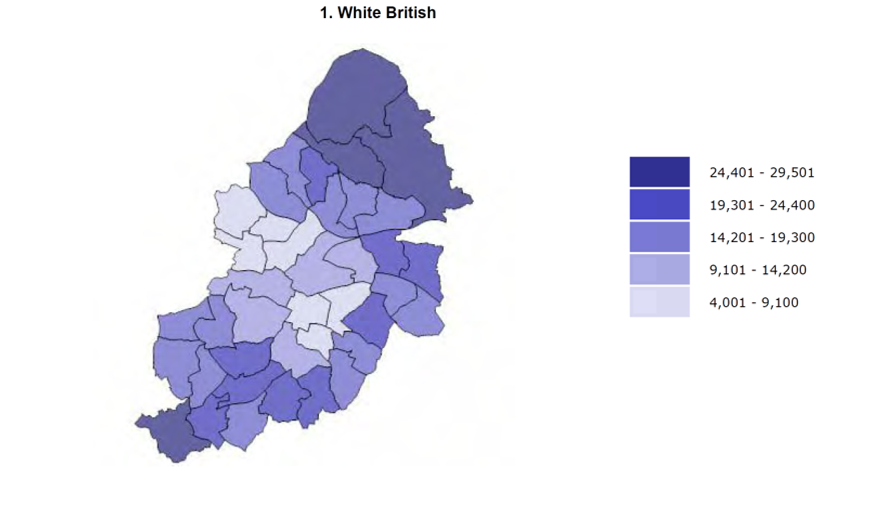
Despite Birmingham being an incredibly culturally diverse city, issues regarding segregation and lack of cultural ethnic integration have been noted to be a concern; so much so that the city council proposed a cohesion strategy as it was deemed that “segregation has reached a ‘worrying level’ in some areas in Britain with deepening inequalities. In some parts of Birmingham we are seeing neighbourhoods and schools segregated by ethnicity and economic inequality.”[1]
The Casey Review was a review carried out in 2015 to investigate such lack of integration. The review found that concentrations of ethnic communities may be positive when people are newly moving to an area but will also limit labour market opportunities, reduce the number of opportunities for social integration between ethnic minority and white British communities as well as leading to a reduced feeling of British self-identification which in turn results in lower levels of trust between segregated ethnic communities.[2]
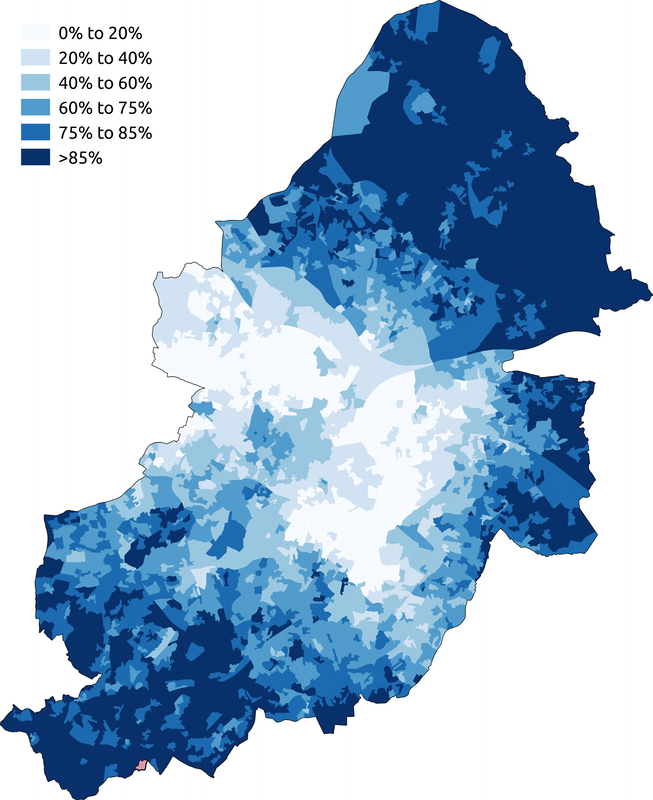
The above figure shows the distribution of ethnic communities within different wards of Birmingham, using the census data of 2001. These figures explore the idea of ethnic segregation as particular areas have a much greater density of particular ethnic group. I was also able to find distribution mapping of ethnic groups for the census data of 2011. These maps show great similarity to those from 2001, despite an increased level of ethnic integration being evident, there are still certain areas within the entirety of Birmingham whereby densities of specific ethnic groups are at its greatest; suggesting that despite the cultural diversity of Birmingham as a whole, there is still room for greater ethnic integration on a local level.
[1] COMMUNITY COHESION STRATEGY FOR BIRMINGHAM GREEN PAPER, (May 2018),p.6, https://birmingham.cmis.uk.com/Birmingham/Document.ashx?czJKcaeAi5tUFL1DTL2UE4zNRBcoShgo=%2F4eHh6Ncj6EpTs8NalbIvdbG4DgoyJE0987bfEchWVSnKKGarpXPUw%3D%3D&rUzwRPf%2BZ3zd4E7Ikn8Lyw%3D%3D=pwRE6AGJFLDNlh225F5QMaQWCtPHwdhUfCZ%2FLUQzgA2uL5jNRG4jdQ%3D%3D&mCTIbCubSFfXsDGW9IXnlg%3D%3D=hFflUdN3100%3D&kCx1AnS9%2FpWZQ40DXFvdEw%3D%3D=hFflUdN3100%3D&uJovDxwdjMPoYv%2BAJvYtyA%3D%3D=ctNJFf55vVA%3D&FgPlIEJYlotS%2BYGoBi5olA%3D%3D=NHdURQburHA%3D&d9Qjj0ag1Pd993jsyOJqFvmyB7X0CSQK=ctNJFf55vVA%3D&WGewmoAfeNR9xqBux0r1Q8Za60lavYmz=ctNJFf55vVA%3D&WGewmoAfeNQ16B2MHuCpMRKZMwaG1PaO=ctNJFf55vVA%3D, [accessed 11/01/2019]
[2] The Casey Report, p.12, https://assets.publishing.service.gov.uk/government/uploads/system/uploads/attachment_data/file/575973/The_Casey_Review_Report.pdf, [accessed 11/01/2019]
Despite Birmingham being an incredibly culturally diverse city, issues regarding segregation and lack of cultural ethnic integration have been noted to be a concern; so much so that the city council proposed a cohesion strategy as it was deemed that “segregation has reached a ‘worrying level’ in some areas in Britain with deepening inequalities. In some parts of Birmingham we are seeing neighbourhoods and schools segregated by ethnicity and economic inequality.”[1]
The Casey Review was a review carried out in 2015 to investigate such lack of integration. The review found that concentrations of ethnic communities may be positive when people are newly moving to an area but will also limit labour market opportunities, reduce the number of opportunities for social integration between ethnic minority and white British communities as well as leading to a reduced feeling of British self-identification which in turn results in lower levels of trust between segregated ethnic communities.[2]
The above figure shows the distribution of ethnic communities within different wards of Birmingham, using the census data of 2001. These figures explore the idea of ethnic segregation as particular areas have a much greater density of particular ethnic group. I was also able to find distribution mapping of ethnic groups for the census data of 2011. These maps show great similarity to those from 2001, despite an increased level of ethnic integration being evident, there are still certain areas within the entirety of Birmingham whereby densities of specific ethnic groups are at its greatest; suggesting that despite the cultural diversity of Birmingham as a whole, there is still room for greater ethnic integration on a local level.
[1] COMMUNITY COHESION STRATEGY FOR BIRMINGHAM GREEN PAPER, (May 2018),p.6, https://birmingham.cmis.uk.com/Birmingham/Document.ashx?czJKcaeAi5tUFL1DTL2UE4zNRBcoShgo=%2F4eHh6Ncj6EpTs8NalbIvdbG4DgoyJE0987bfEchWVSnKKGarpXPUw%3D%3D&rUzwRPf%2BZ3zd4E7Ikn8Lyw%3D%3D=pwRE6AGJFLDNlh225F5QMaQWCtPHwdhUfCZ%2FLUQzgA2uL5jNRG4jdQ%3D%3D&mCTIbCubSFfXsDGW9IXnlg%3D%3D=hFflUdN3100%3D&kCx1AnS9%2FpWZQ40DXFvdEw%3D%3D=hFflUdN3100%3D&uJovDxwdjMPoYv%2BAJvYtyA%3D%3D=ctNJFf55vVA%3D&FgPlIEJYlotS%2BYGoBi5olA%3D%3D=NHdURQburHA%3D&d9Qjj0ag1Pd993jsyOJqFvmyB7X0CSQK=ctNJFf55vVA%3D&WGewmoAfeNR9xqBux0r1Q8Za60lavYmz=ctNJFf55vVA%3D&WGewmoAfeNQ16B2MHuCpMRKZMwaG1PaO=ctNJFf55vVA%3D, [accessed 11/01/2019]
[2] The Casey Report, p.12, https://assets.publishing.service.gov.uk/government/uploads/system/uploads/attachment_data/file/575973/The_Casey_Review_Report.pdf, [accessed 11/01/2019]
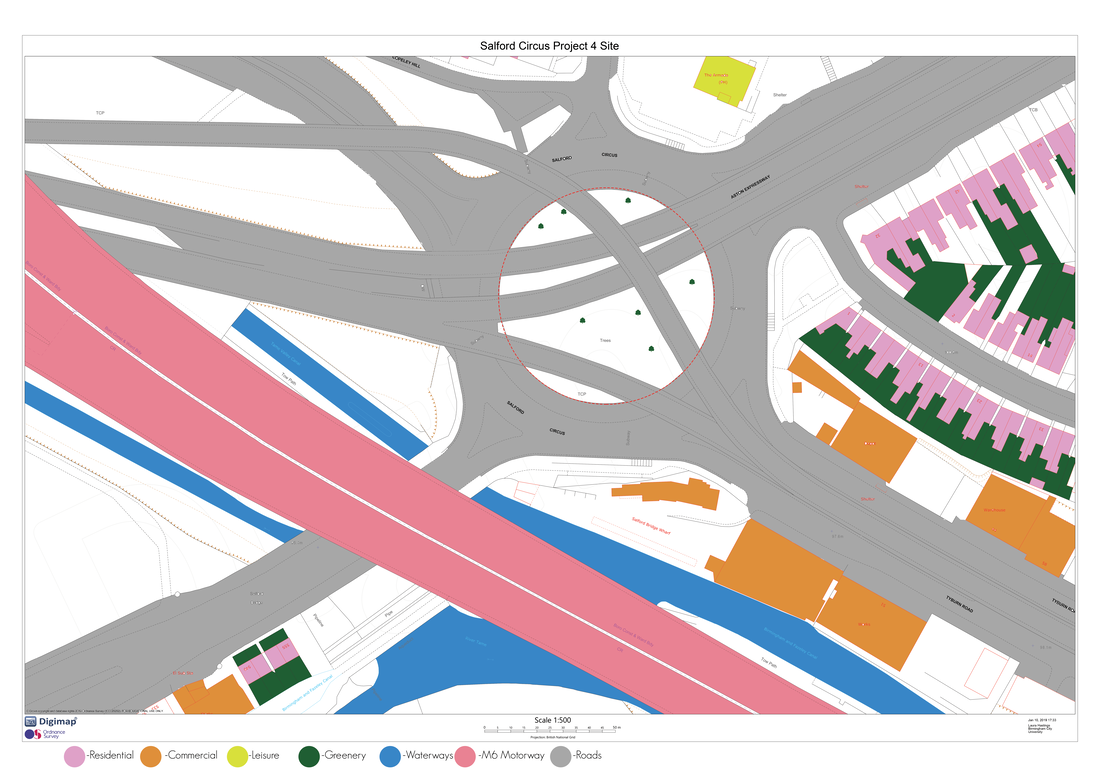
Land & Building Use
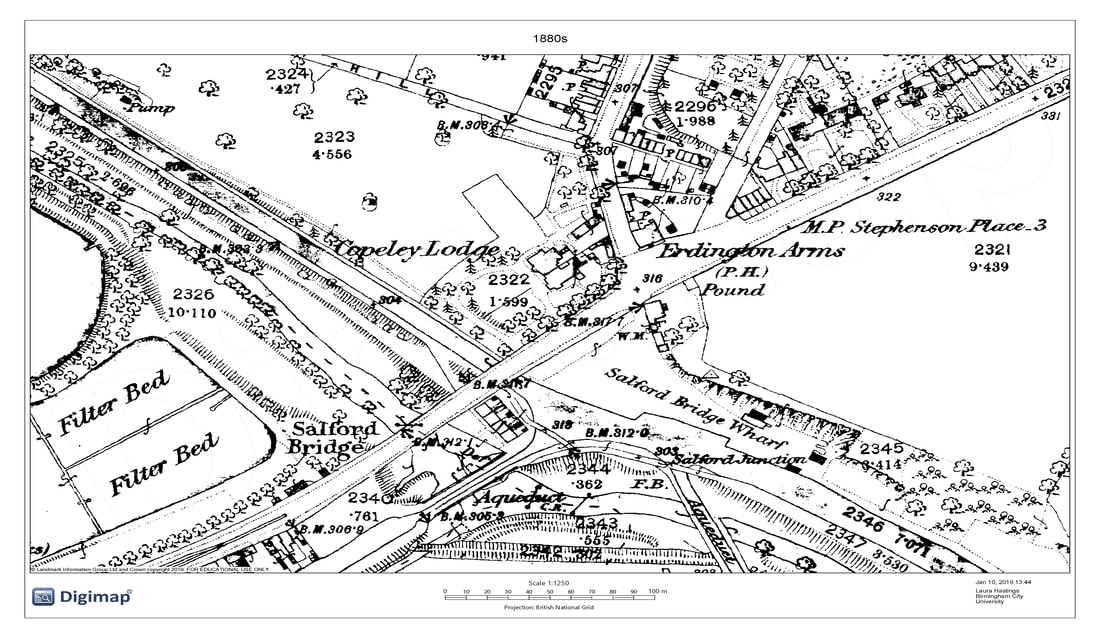
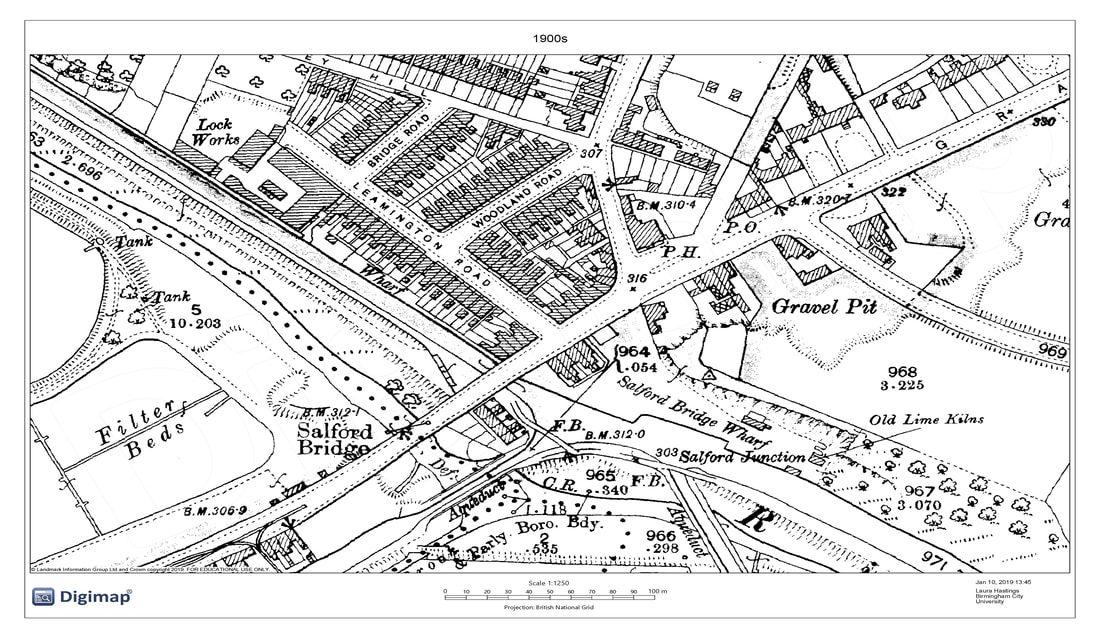
Historical Maps
Historic Maps, Digimap, https://digimap.edina.ac.uk/roam/map/historic, [accessed 10/01/2018]
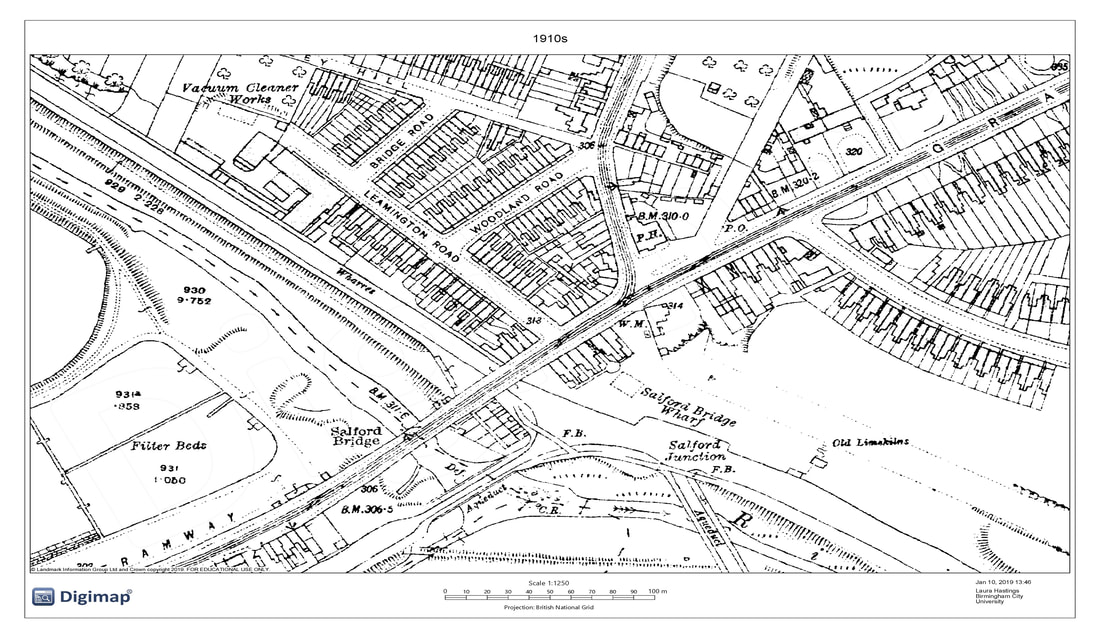
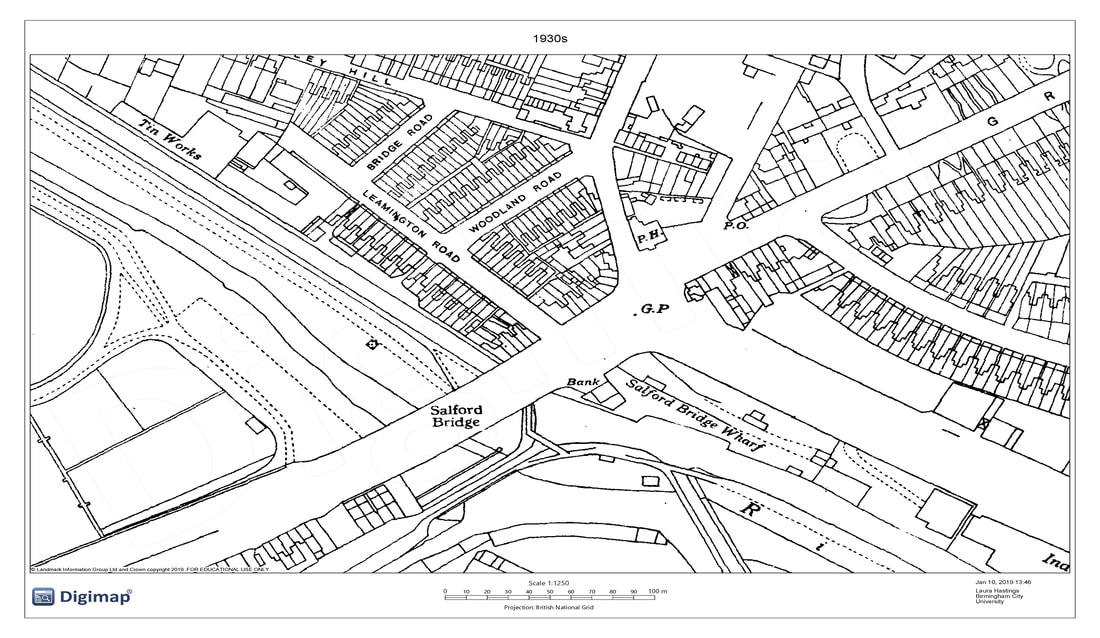
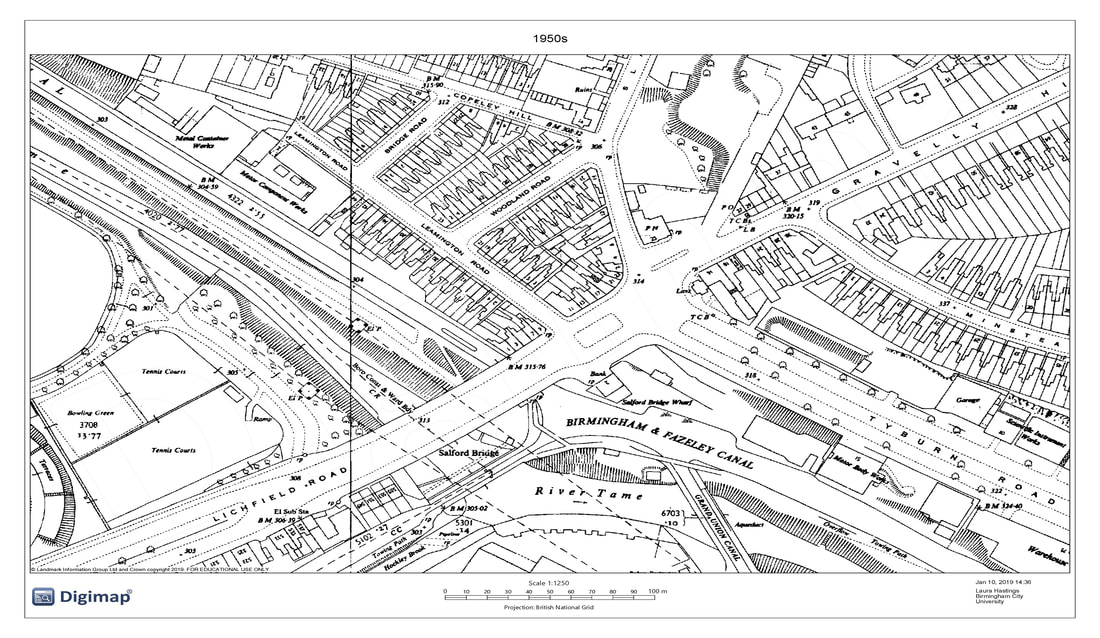
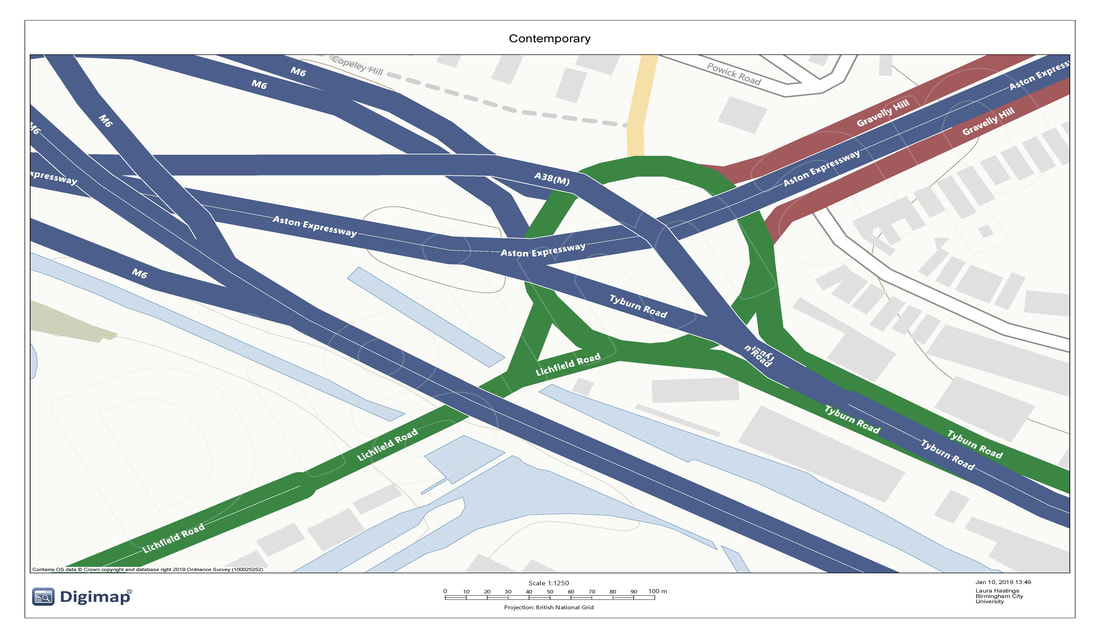
From the historical maps, we can see that from the 1880s, the roads leading into the Spaghetti Junction were always main roads and arteries into Birmingham. Only recently though, since 1950, has the junction taken shape to what we know it as being today. Historically, cars weren't invented until 1885 and so between the 1880s and the 1910s, the roads are much thinner than in the later maps as most transportation of goods occurred through canals- Erdington would have been in a prime spot for the movement of goods as it sits along the River Tame and Fazeley Canal. As motorised vehicles became the most common form of goods transportation, the roads were developed further to be able to take larger volumes of traffic. From 1880s to the 1900s there was evidently a residential push in the area with arable land having been built on. Erdington, in particular Gravelly Hill, has been an area occupied by residential dwellings and industrial ventures with the Erdington Arms being the local Pub which was a Victorian Pub which was later replaced by the Armada and more recently by a petrol station. The most recent shift in use of this land provides us with evidence of the growing importance of this specific feature of infrastructure in Birmingham. There has also been a shift, over the period of these maps, from heavy industry to lighter industry and more commercial sectors.
Pollution Levels
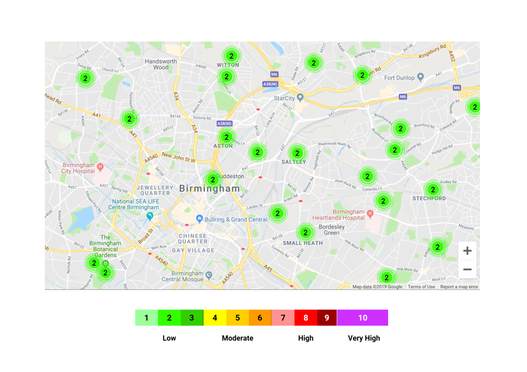
Air Pollution Levels, https://uk-air.defra.gov.uk/forecasting/locations?q=powick%20road,%20birmingham&day=1#map_summary, [accessed 10/01/2019]
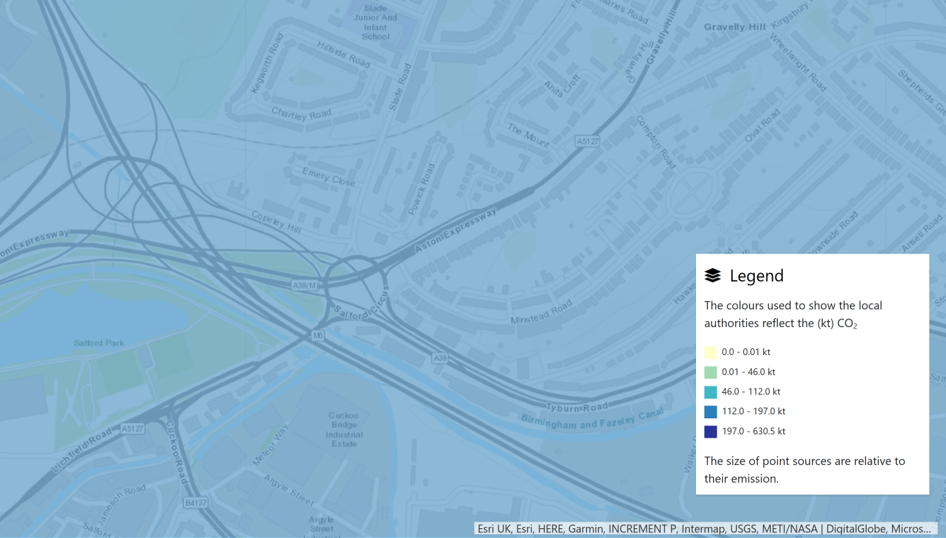
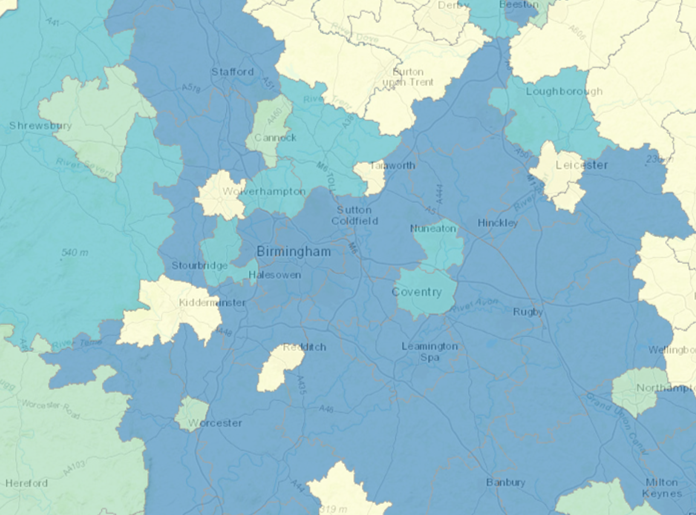
CO2 Levels from Local Authority Data, http://naei.beis.gov.uk/laco2app/, [accessed 10/01/2019]
|
Our site for Project 4 is located underneath a key part of Spaghetti Junction, Birmingham. It is a key artery into the centre of Birmingham and therefore experiences heavy traffic flow- especially during rush hours. The Air pollution map from Defra is produced from MET office data in order to forecast the level of pollutants that may be hazardous to health including nitrogen dioxide, sulphur dioxide and ozone. This specific map shows that the level of air quality is deemed to be high with low levels of pollution and is graded at a 2, using the Daily Air Quality Index.[1]
However, the first map does not take into account the CO2 emissions locally. Instead, this data was accessed via the National Atmospheric Emissions Inventory. The maps here instead show CO2 levels recorded by each local authority body. It is evident from these that Birmingham experiences a much greater level of CO2 emission than other areas nationally, with Birmingham coming in the 112.0kt-197.0kt bracket.[2] [1] What do the Forecasts mean?, https://uk-air.defra.gov.uk/forecasting/what-forecasts-mean, [accessed 10/01/2019] [2] National Atmospheric Emissions Inventory, http://naei.beis.gov.uk/laco2app/, [accessed 10/01/2019] |